Jerramungup Community
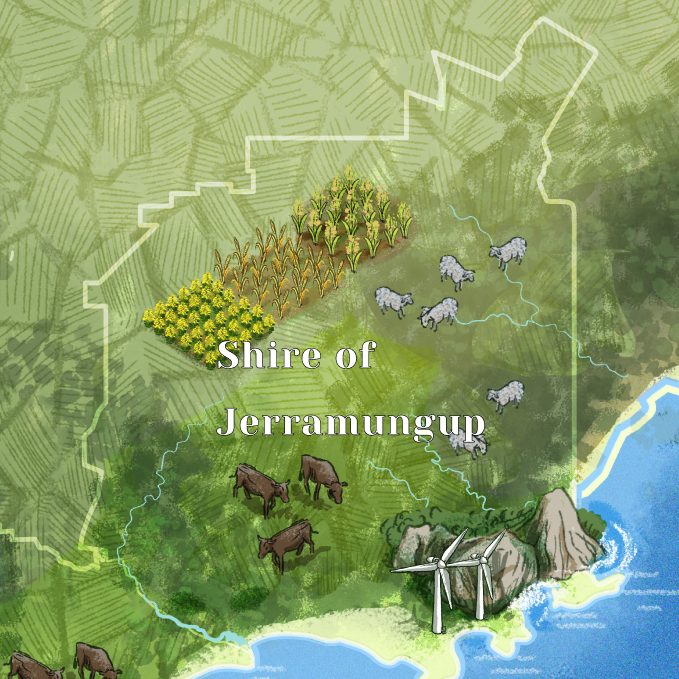
Jerramungup is the eastern most region of the south coast area. Jerramungup has a small but growing population of around 1,200 residents, most of whom live either in Jerramungup town, or in Bremer bay.
Jerramungup covers the traditional lands of the Noongar people who have cared for the lands and waters for millenia.
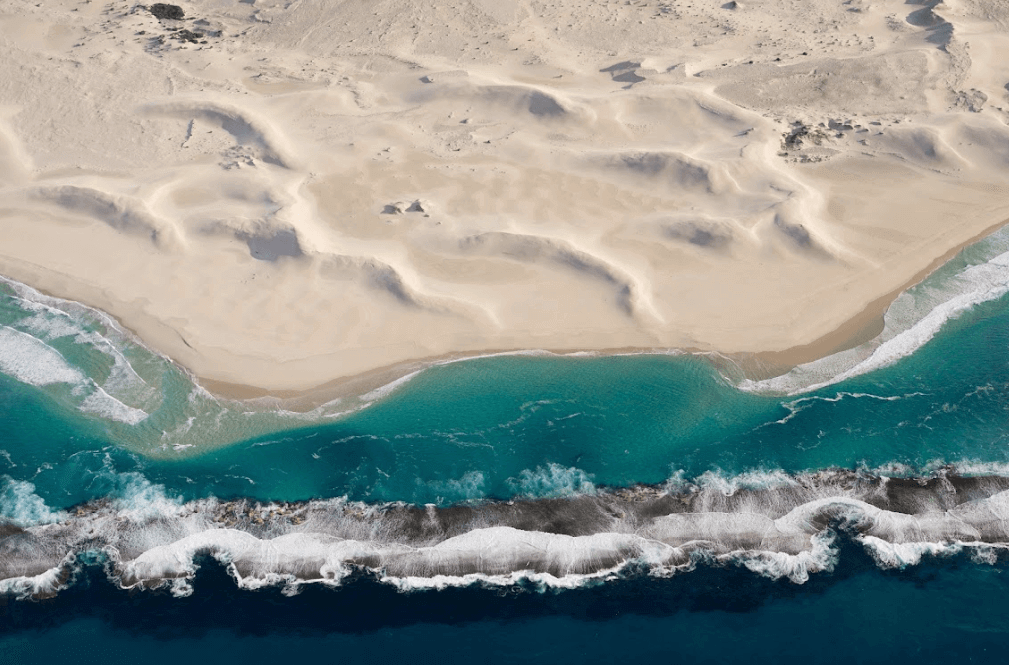
The region includes the westernn part of the Fitzgerald River National Park, one of the largest in Australia. The park covers 329,039 hectares and is one of the most diverse botanical areas in the world. Off the coast there is the Bremer Bay Marine Park, another designated national park of 4,472 km2, that is home to many key species, including Orca.
Jerramungup contributes $113 million of the Great Southern’s gross regional product. Agriculture is the main employer, but the national park and stunning coastline is driving an increase in tourism in the area as well.
What’s changing in the climate?
My Climate View and Climate Change in Australia, produced by the Bureau of Meteorology and CSIRO, provide local and regional climate change information, including past trends and future projections in temperature and annual and seasonal rainfall. These graphs show changes to temperature and rainfall under a medium emissions scenario.
Maximum temperature: Average decadal temperatures are steadily increasing. Projections indicate that warming will continue, together with a significant increase in hot days.
Rainfall: Historical annual rainfall trends have declined. Future projections anticipate that annual rainfall will continue to decrease, particularly in winter and spring.
Projected Change in Average Summer Temperature for Jerramungup
The average annual maximum temperature for the Shire of Jerramungup showing past temperature trends from 1965 and future projections to 2085. Source: MyClimateView, Variable: average summer temperature, region: Bremer Bay
Projected Change in Annual Rainfall for Jerramungup
The total annual rainfall for the Shire of Jerramungup showing the past rainfall from 1965 and future rainfall projections to 2085. Source: MyClimateView, Variable: annual rainfall, region: Bremer Bay
The current state of emissions
With a small population of around 1,200 people and a small commercial sector, the majority of emissions for Jerramungup come from agricultural activities. This is a mix of broadacre crops and livestock. For broadacre crops like wheat and barley, emissions generally arise from fertilizer use and diesel. For livestock, the majority of emissions come from methane emitted from the animals’ digestion, and the breakdown of manure.
Carbon Emissions for Jerramungup for 2021/22
The carbon emissions for the Shire of Jerramungup (total = 138,000 tCO₂e, 21/22), divided into emissions source. Hover your cursor over the donut to see what makes up Jerramungup’s emissions profile. Source: snapshotclimate.com.au
Where we’re heading
Under a Business as Usual scenario, Jerramungup’s emissions are anticipated to increase over the coming years as there are further expansions in agricultural activity and associated economic growth.
This increase will be offset somewhat by the greening of the electricity grid (which should decrease in its emissions intensity by 2050, making many households and businesses green by default) and the adoption of other solutions like solar PV and the electrification of transport.
Projected Carbon Emissions for Jerramungup
The carbon emissions projection from 2022 to 2050 for the Shire of Jerramungup, separated by sector. Hover your cursor over the bars to see what is projected to make up Jerramungup’s emissions profile by sector each year. Source: South Coast Alliance Regional Net Zero Plan – Ironbark Sustainability 2022
Opportunities for action
The South Coast Alliance has looked a a range of actions that the community of Jerramungup can take to see what are the most effective actions.
These local actions vary from installing solar PV systems, to driving more efficient cars, to changes to agricultural practices that reduce fertilizer use. The collective impact of these actions could be substantial – by 2050 they may reduce community emissions by almost 70%.
To better understand these actions and what options you can take yourself, click through below.
Projected Emissions for Business as Usual vs Action for Jerramungup
Two possible scenarios for emissions in the Shire of Jerramungup from 2022 to 2050. The red line indicates the projected emissions if the community were to continue Business as Usual. The green line shows the potential reduction in emissions if all actions on this website are implemented. Source: South Coast Alliance Regional Net Zero Plan – Ironbark Sustainability 2022
Explore by Sector
We’ve grouped the actions that people in the community can take into “sectors”. You may be interested in more than one sector – for example your household and your small business.
Some sectors can be significantly impacted by the collective actions of individuals, for others the action might be more about education or advocacy.
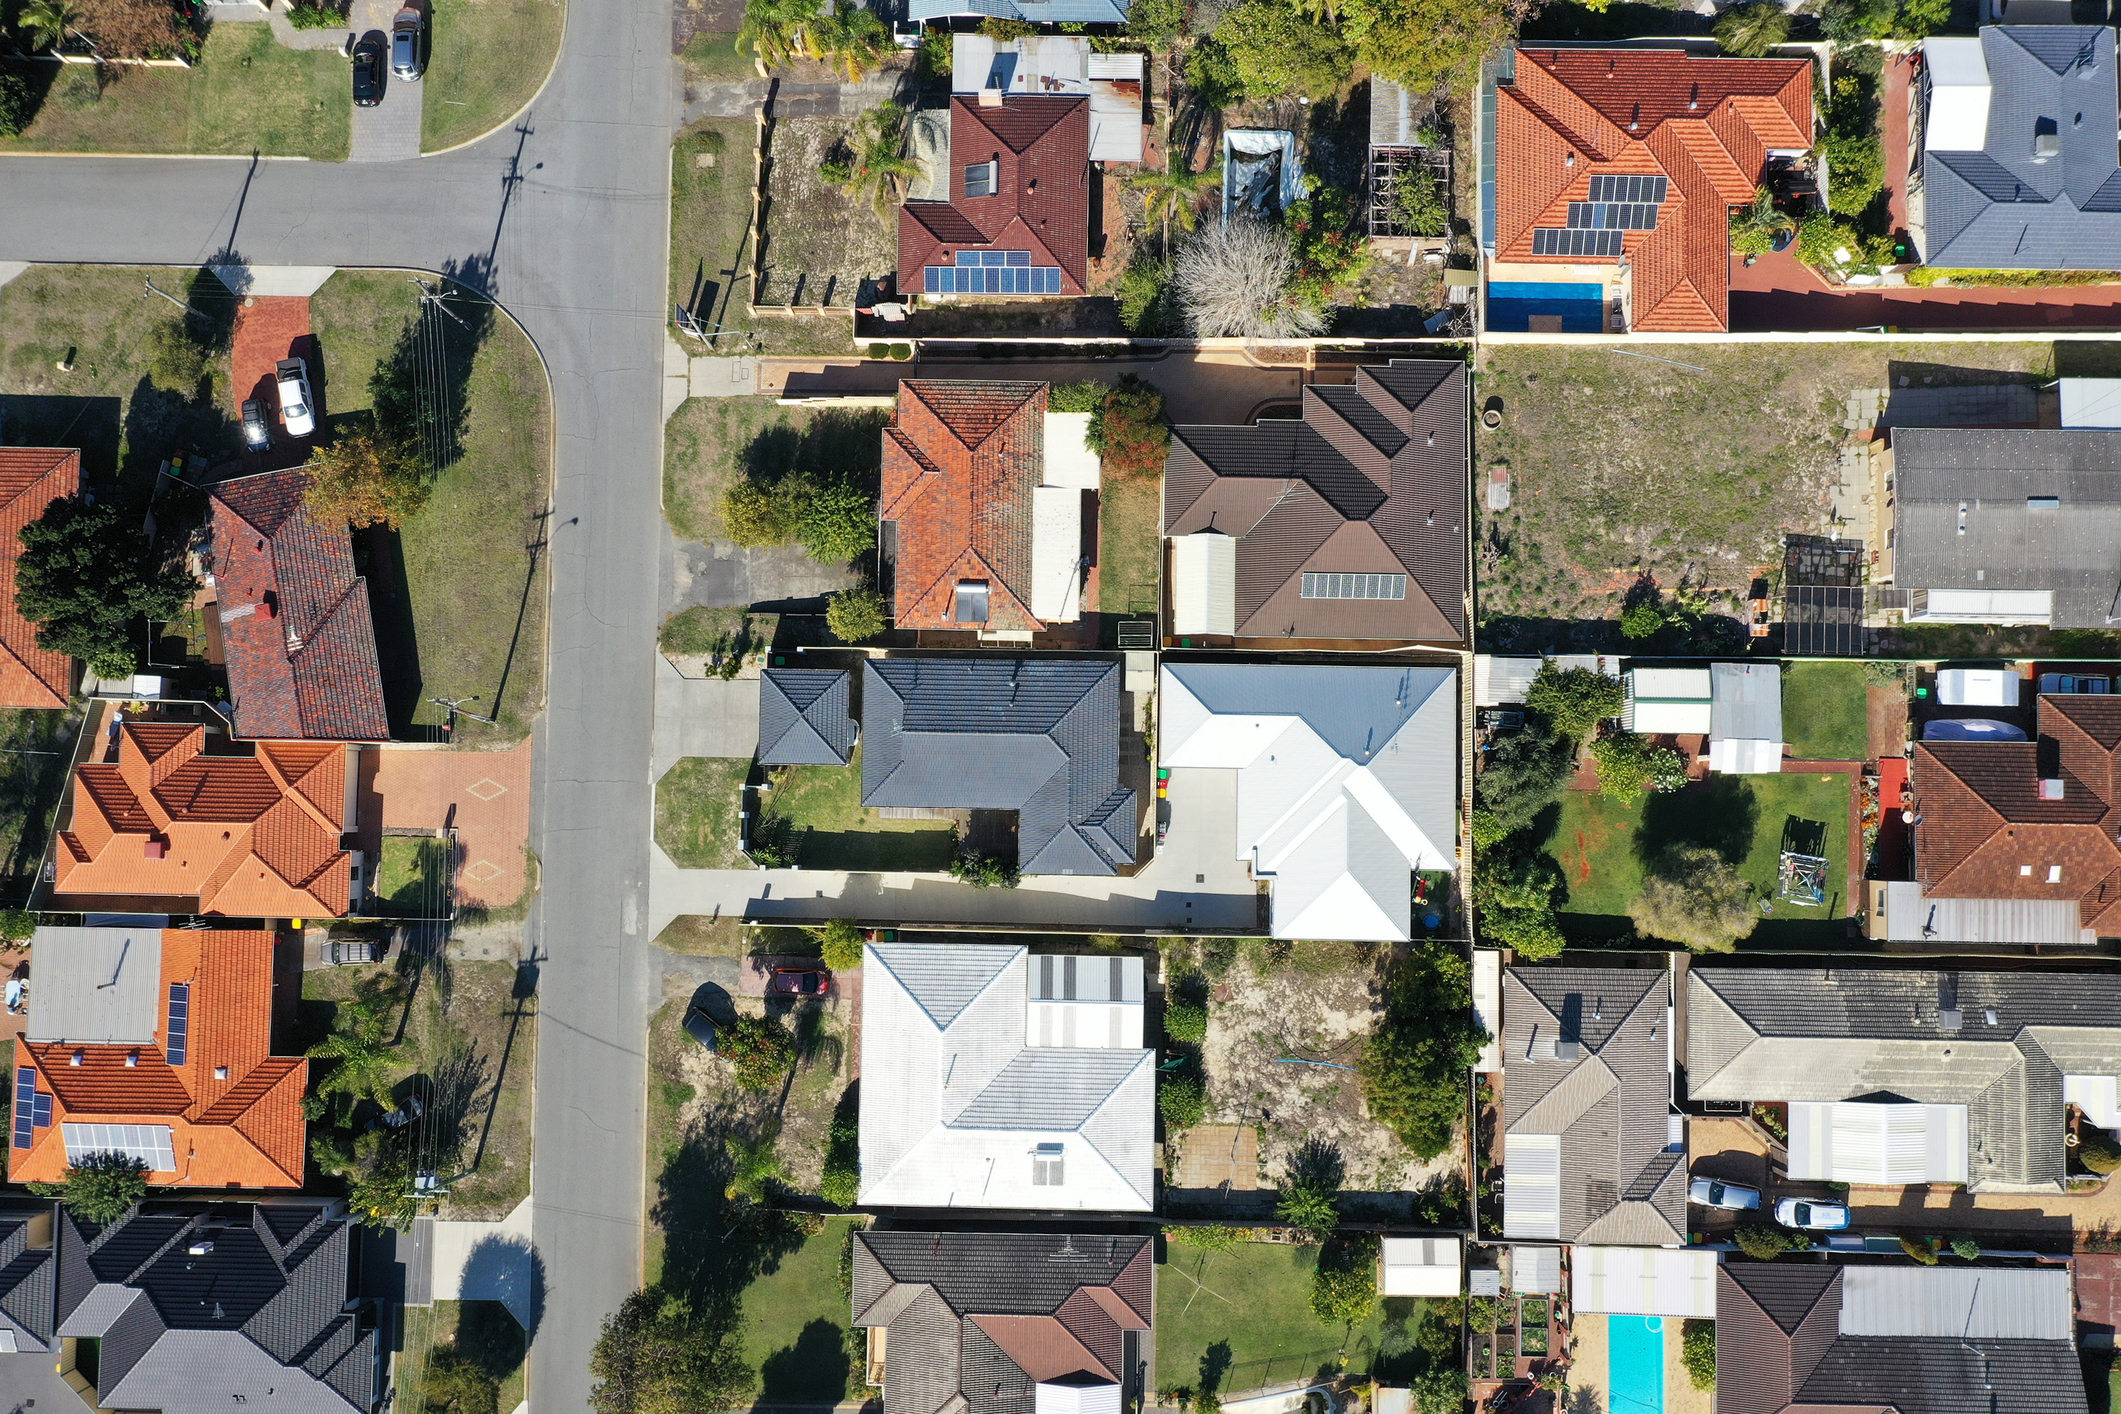
Households
Jerramungup has the smallest population for the region of the South Coast, with half of these residents living in Bremer Bay.

Small Businesses
Commercial consumption make a small fraction of Jerramungup’s electricity emissions, but local businesses can benefit from swapping to renewable energy sources. Tourism and the related support infrastructure comprise almost all commercial activity that is not related to Agriculture
Transport
Transport emissions make up a significant proportion of the emissions of Jerramungup, coming predominantly from private motor vehicles.
Changes to how people get around will be needed to reduce emissions in this area, including swapping to electric vehicles and more active modes of transport.
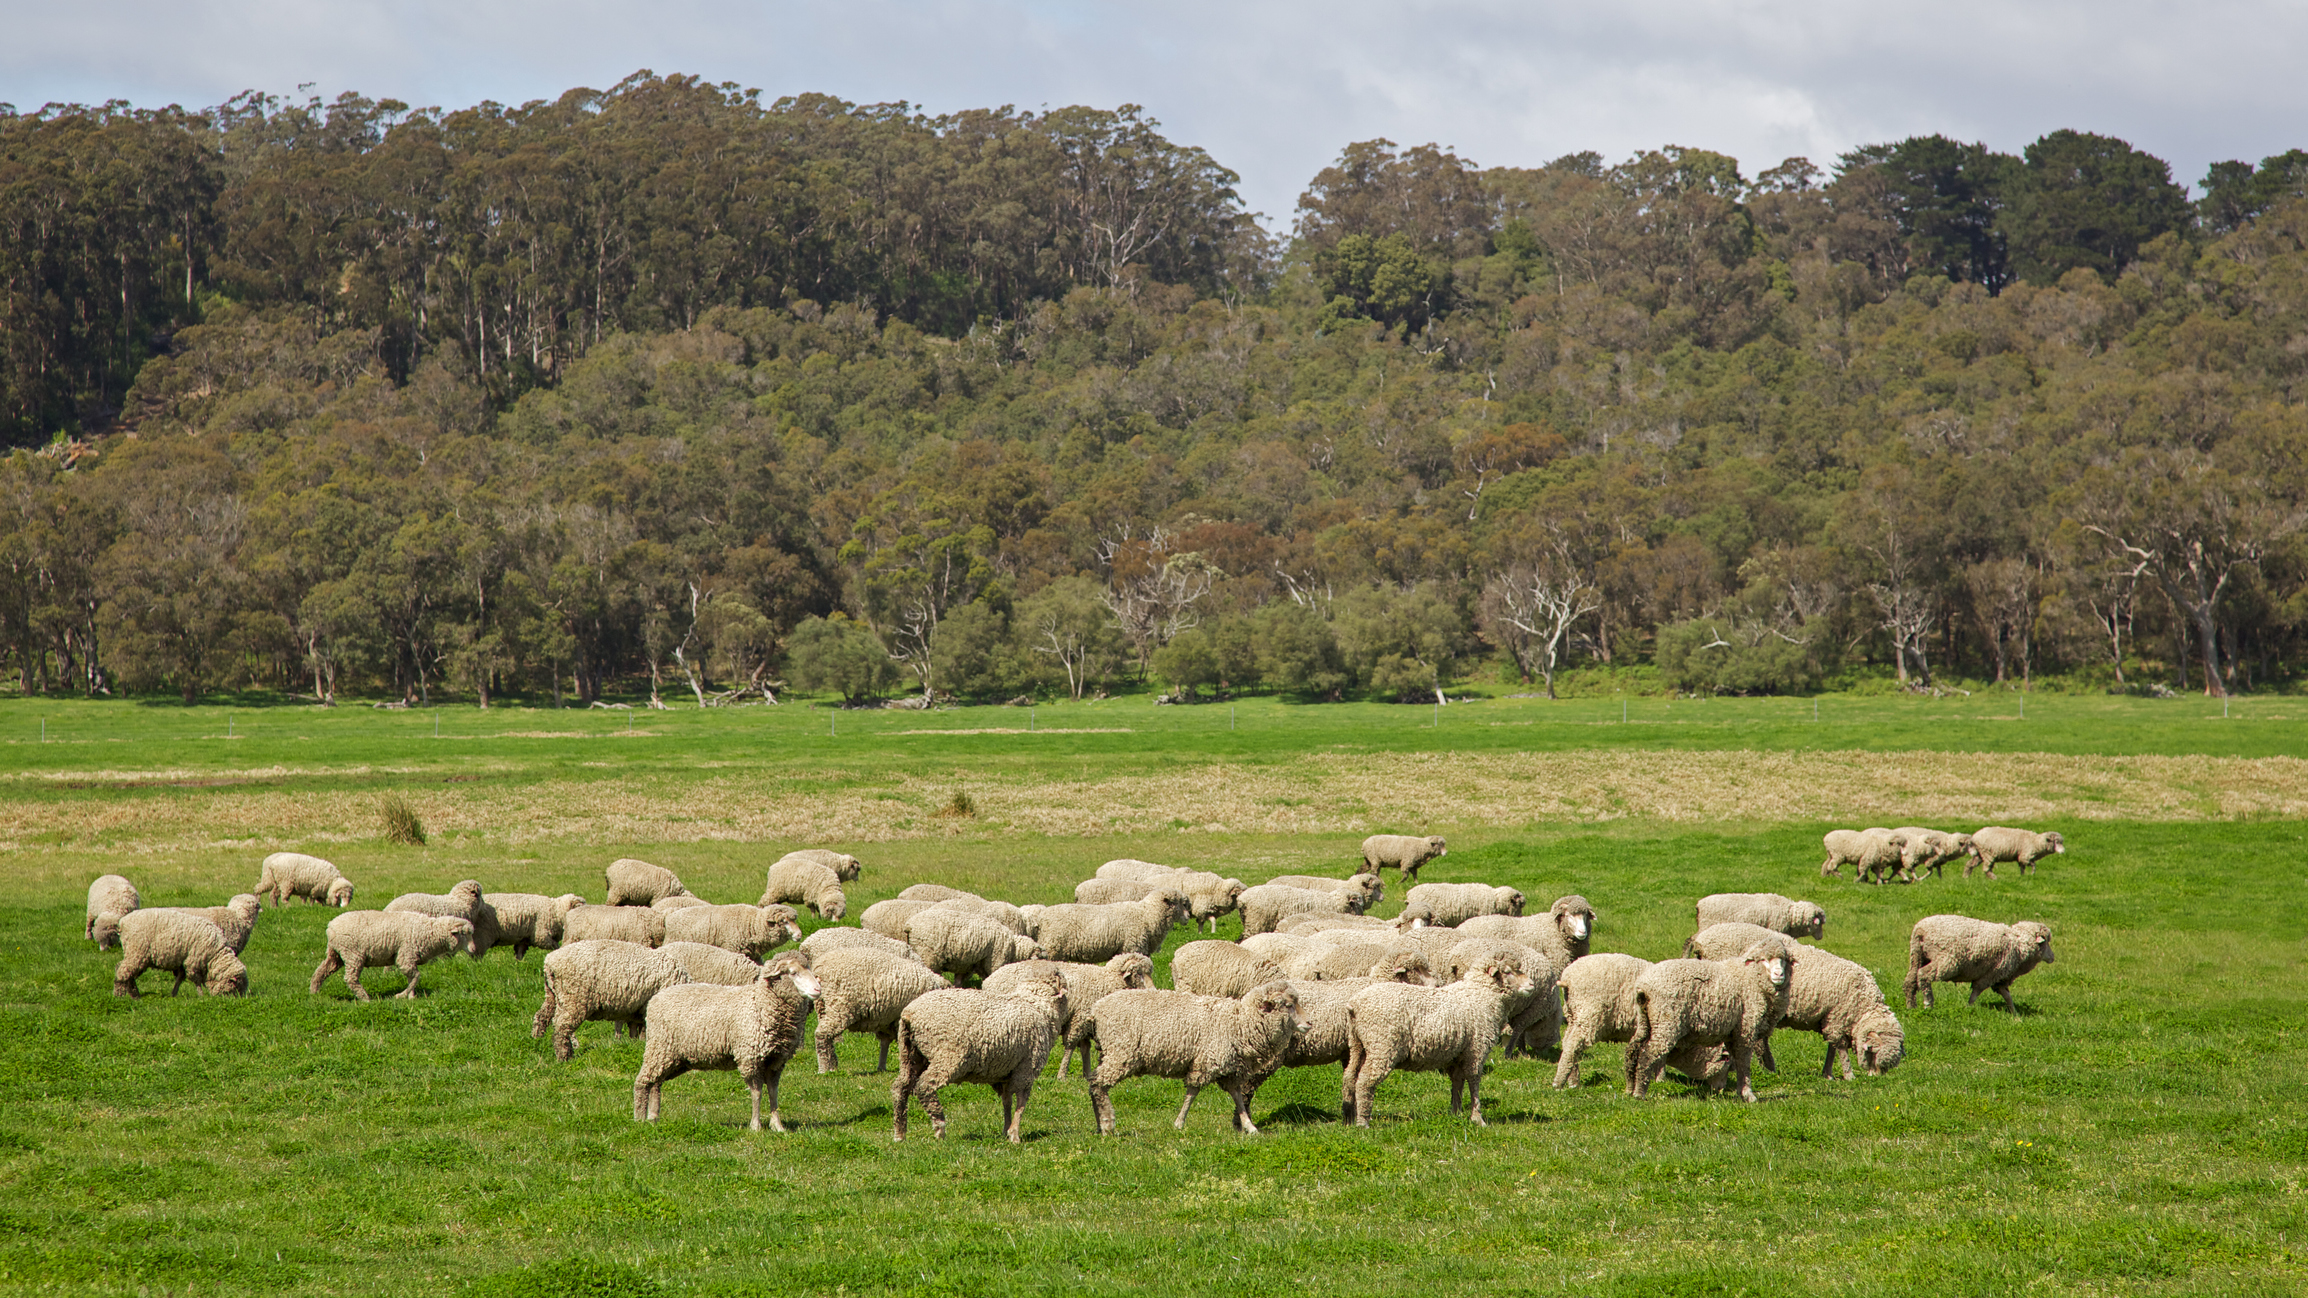
Agriculture
Agricultural emissions make up the biggest proportion of emissions in Jerramungup, and come predominantly from sheep and beef cattle.
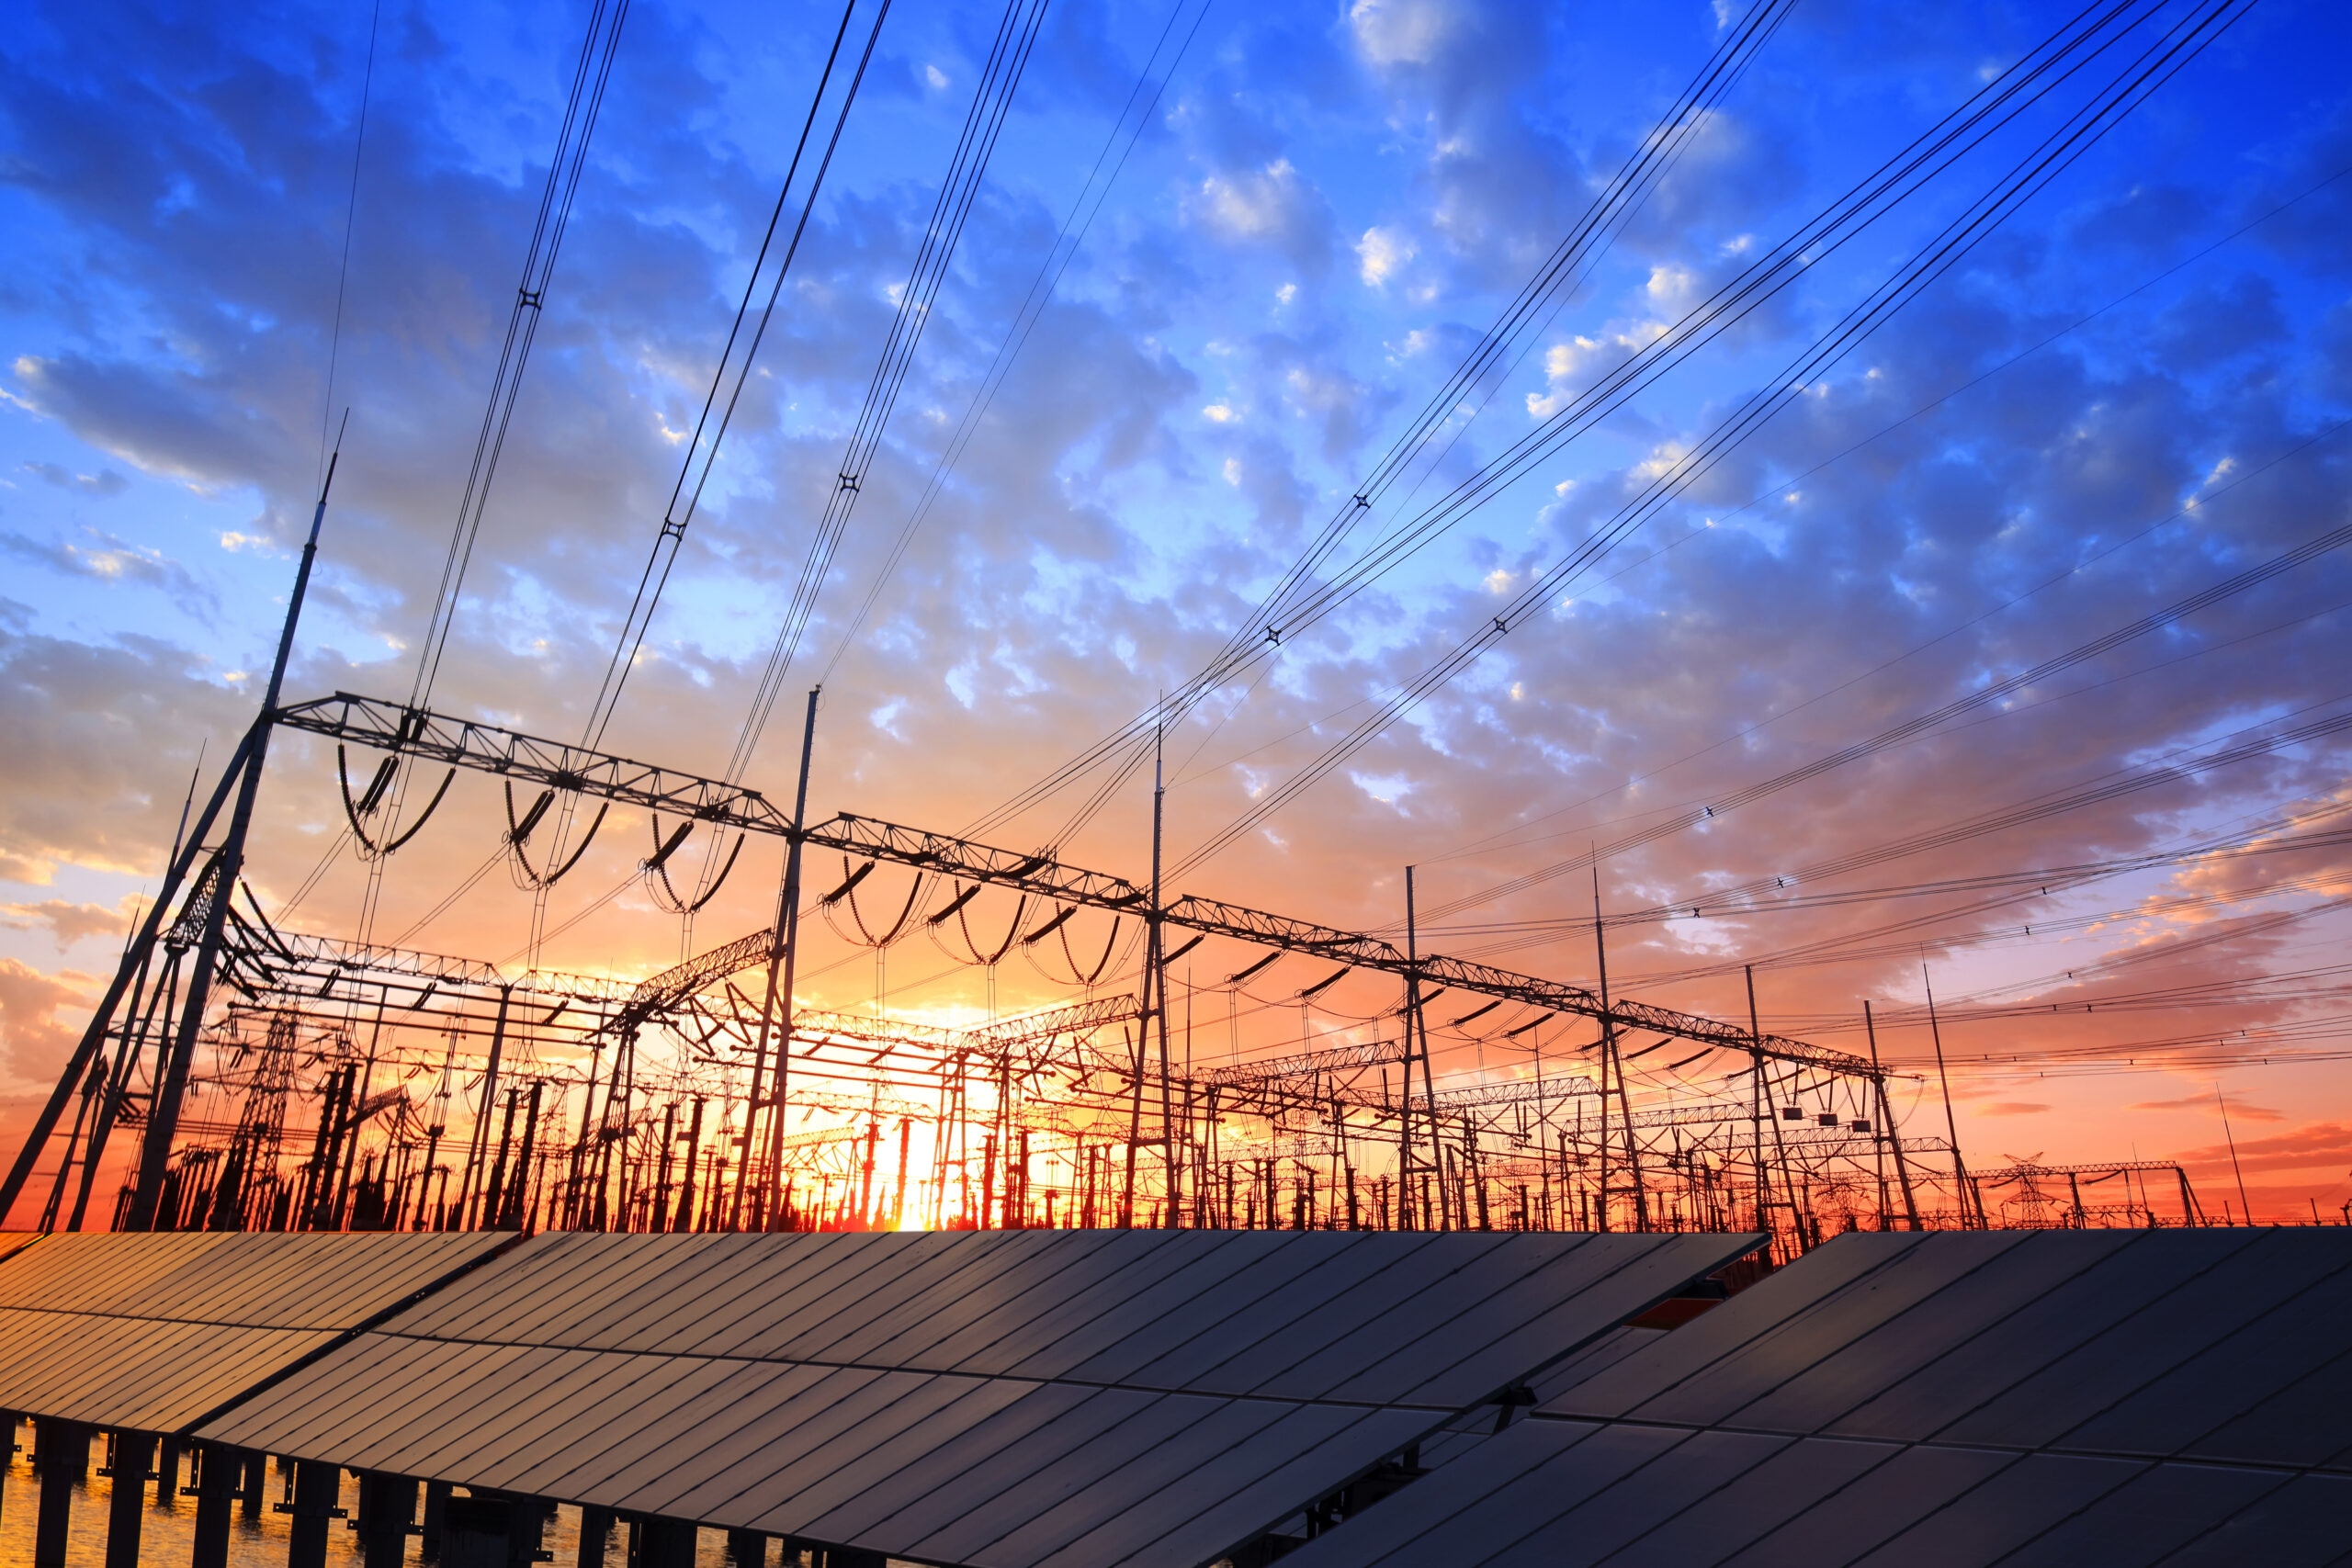
Industry & Grid
A large proportion of Jerramungup’s municipal electricity emissions come from Industry, making it a key area to focus on for mitigation activities.
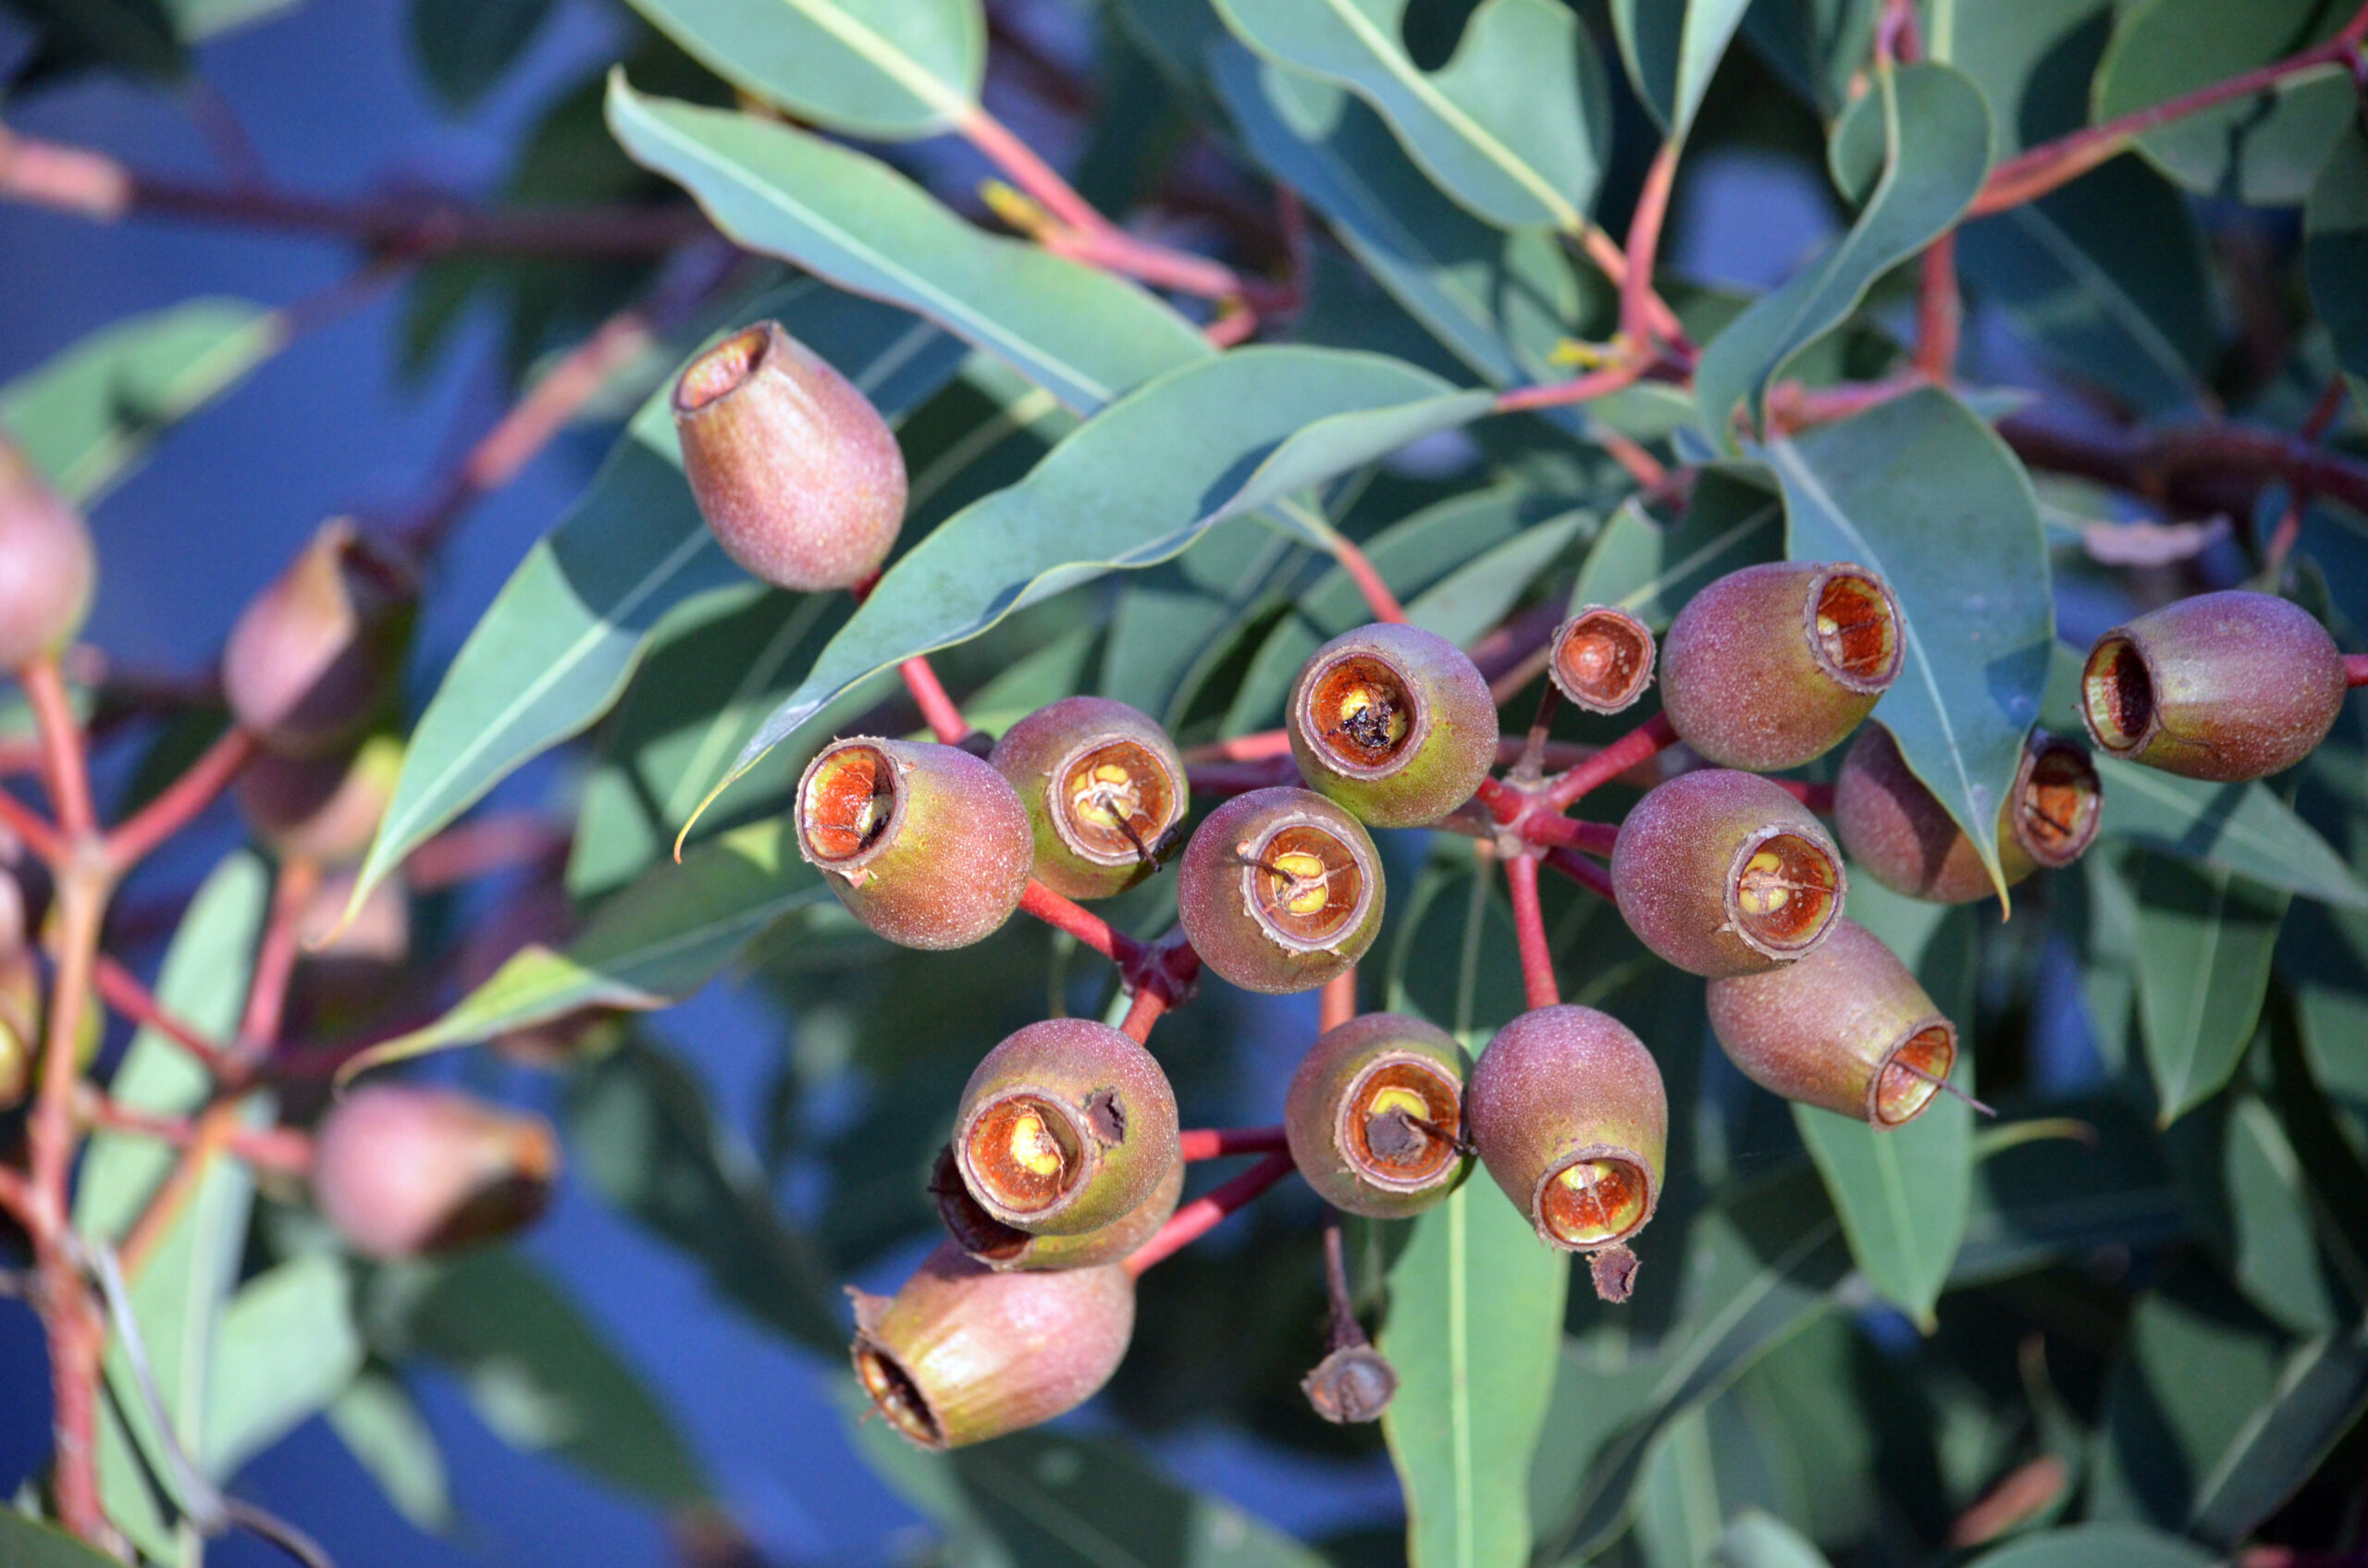
Land Use & Ecosystems
The Land Use and Ecosystem sector concerns changes to emissions based on the loss or gain of vegetation, and to ecosystem health more generally.
Revegetating degraded land and waters can reduce emissions, increase biodiversity, and support healthier communties.
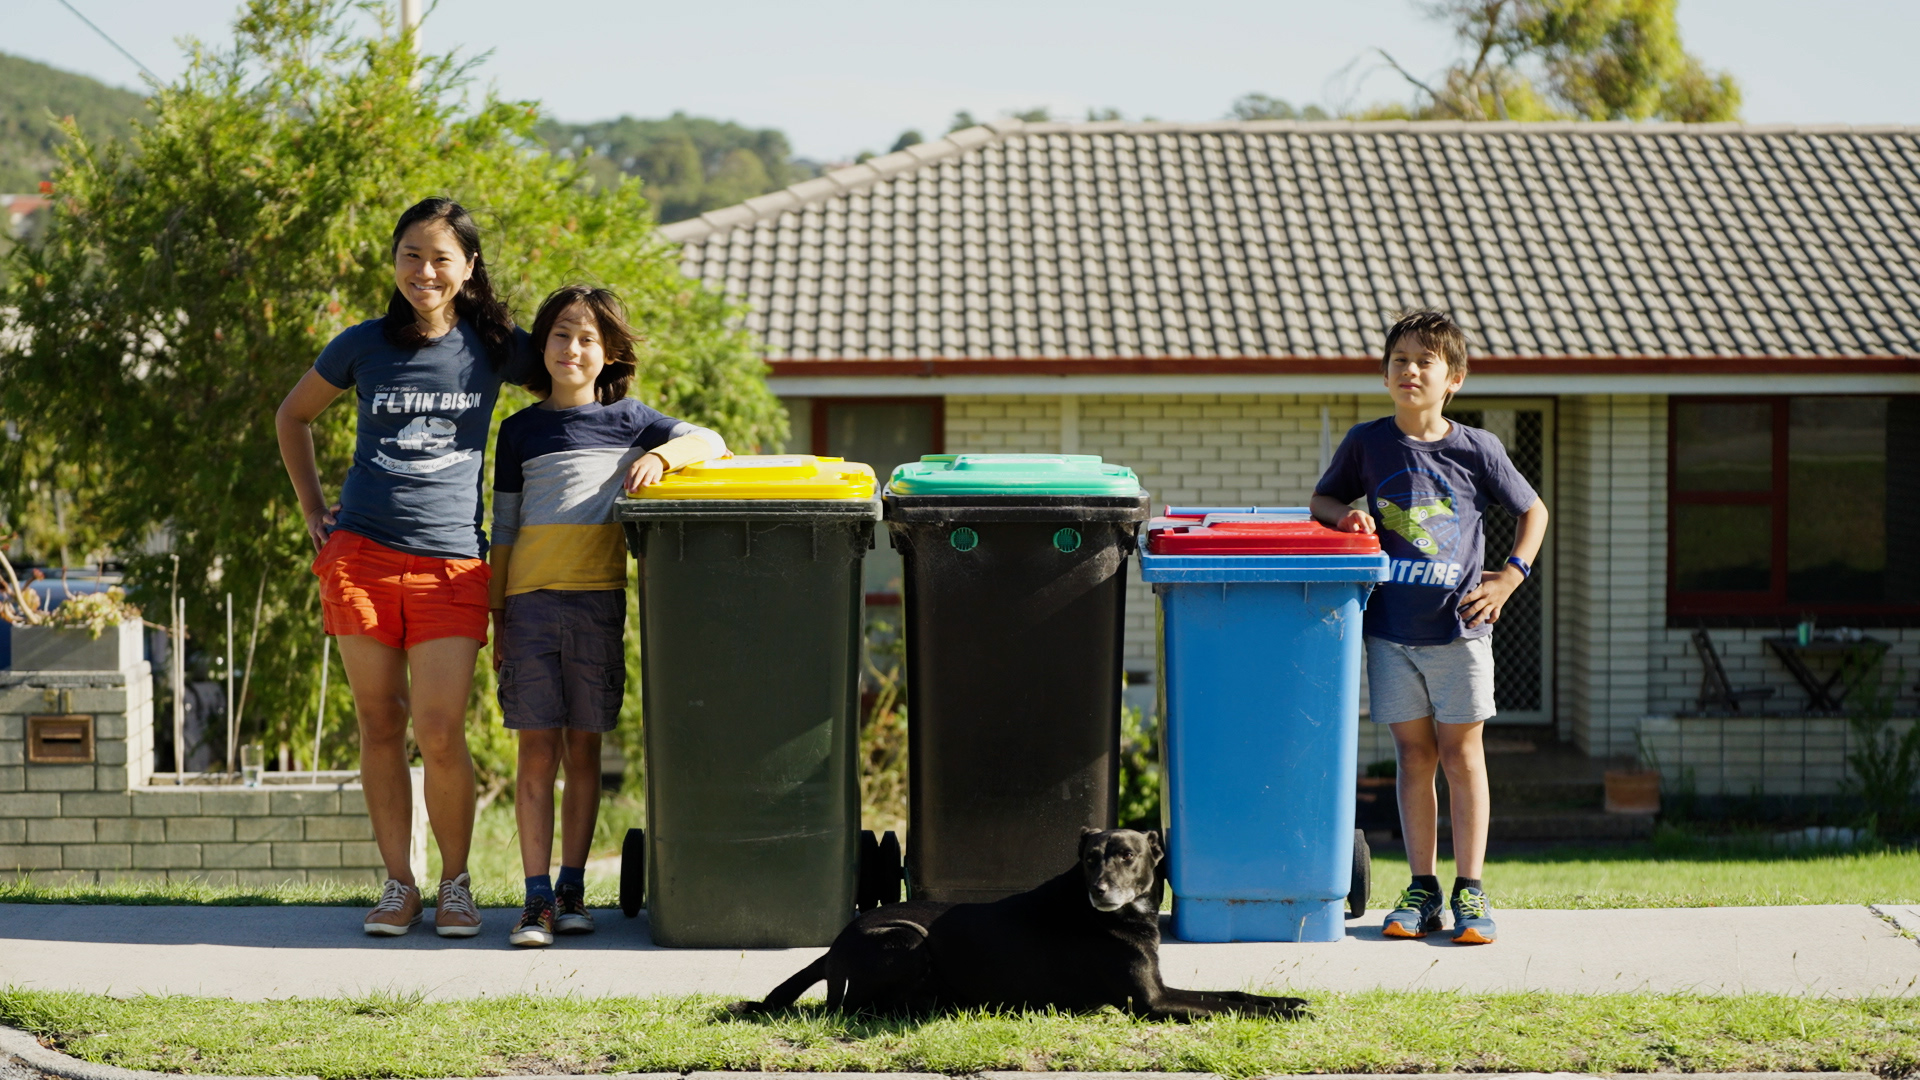
Waste Management
Landfill makes a small contribution to Jerramungup’s emissions.
Better management of organic and other waste from our homes and businesses can have numerous benefits for the health of our gardens and paddocks, sustainability of our supply chains, and associated waste management costs.
Who’s taking action in the region?
Regional Success Stories
-
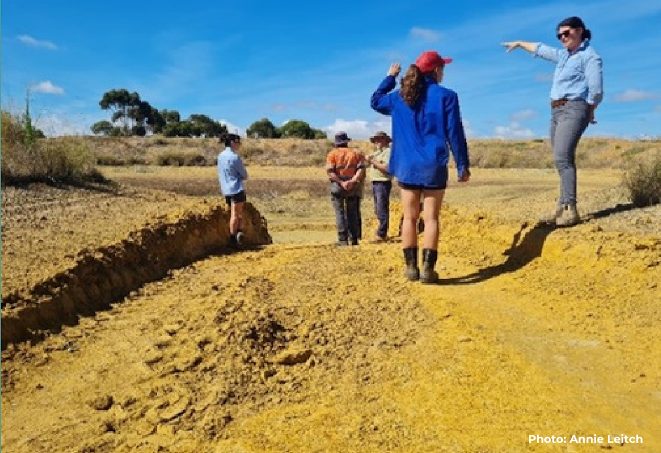
WaterSmart Dams

Discover WaterSmart Dams, a transformative project addressing the challenges of climate change in agriculture. The initiative reimagines dam technologies, optimising catchment design and enhancing water quality for sustainable farming. Explore how this collaboration is shaping a resilient future for regional agriculture. Read the case study here (PDF).
-
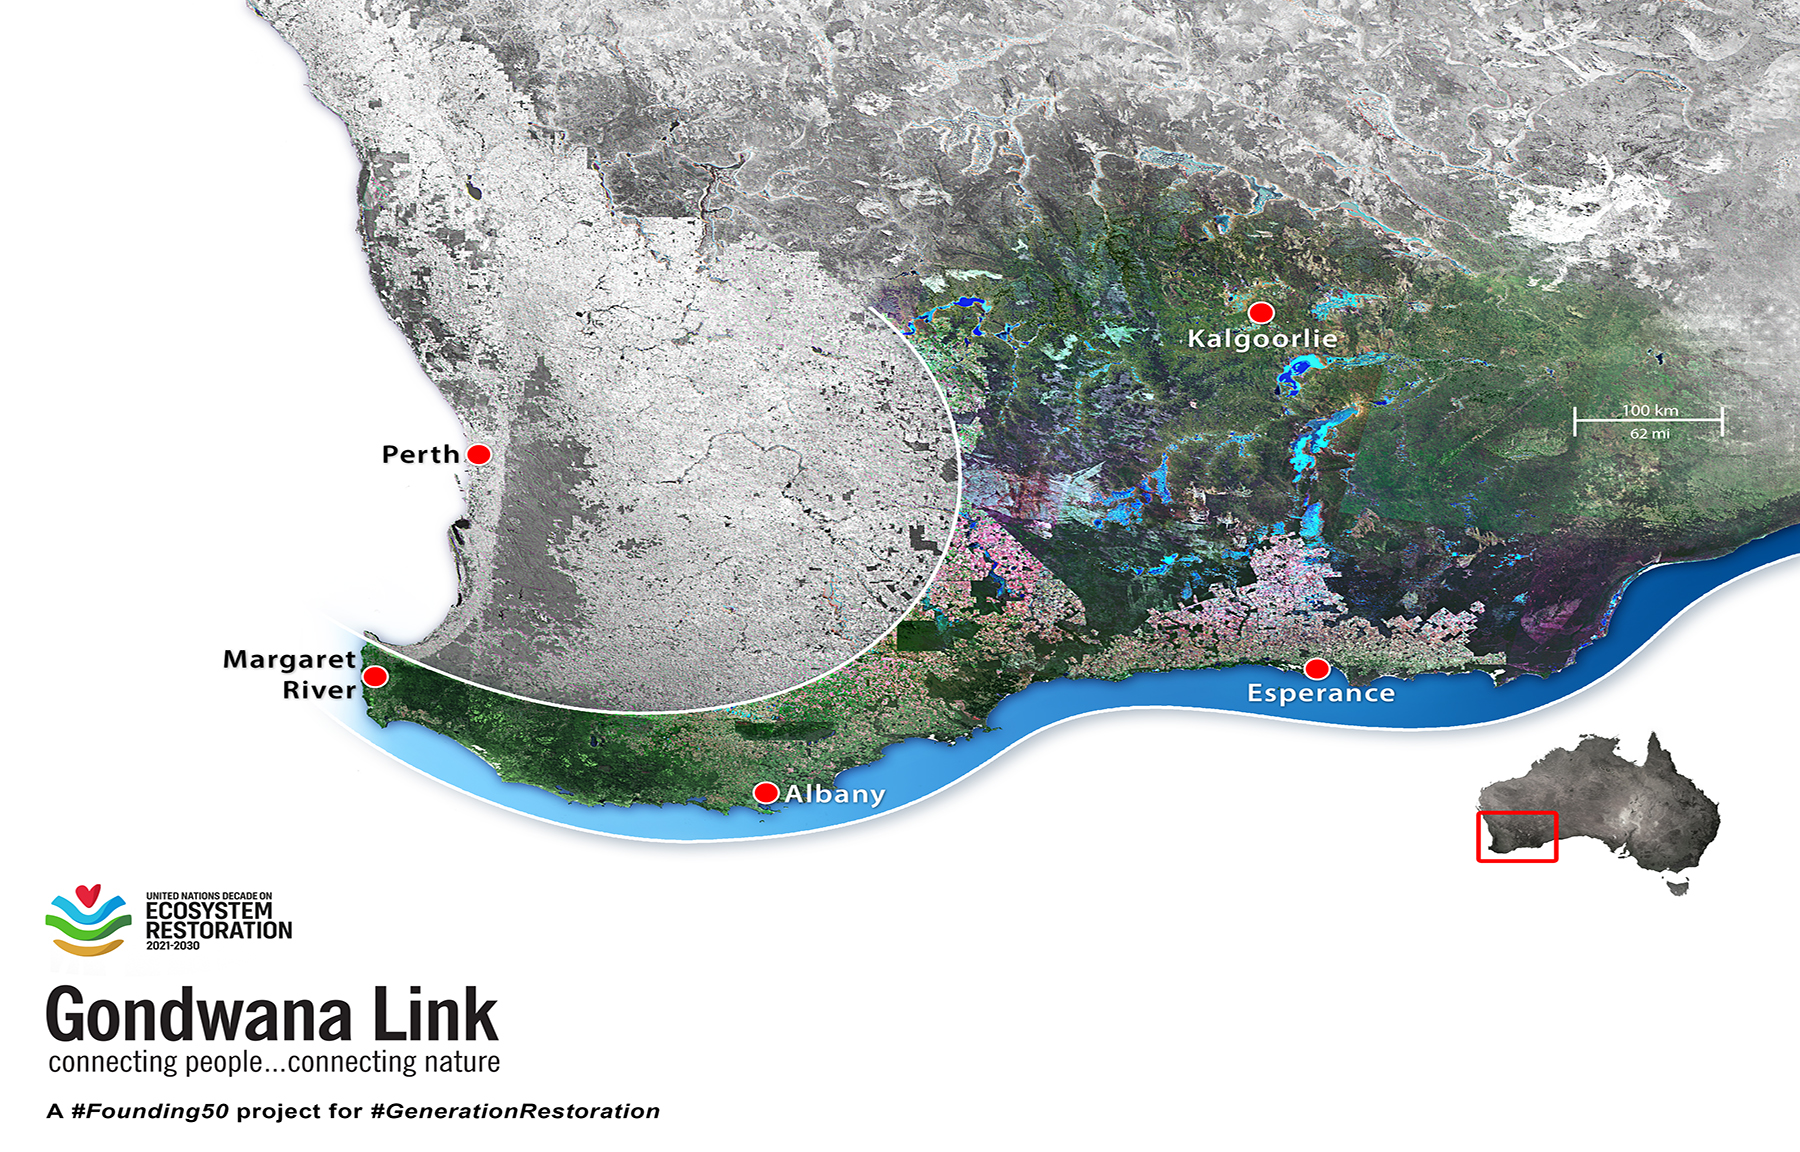
Gondwana Link’s 1000 Kilometres of Hope

Gondwana Link’s 1000 Kilometres of Hope. Embark on a transformative journey with Gondwana Link as they restore 1000 kilometres of vital habitats in south-western Australia. Discover how their innovative approach, leveraging international support and strategic conservation, is fostering biodiversity, ecological resilience, and community impact in the face of climate change. Read the case study here…