Agriculture
What’s happening now
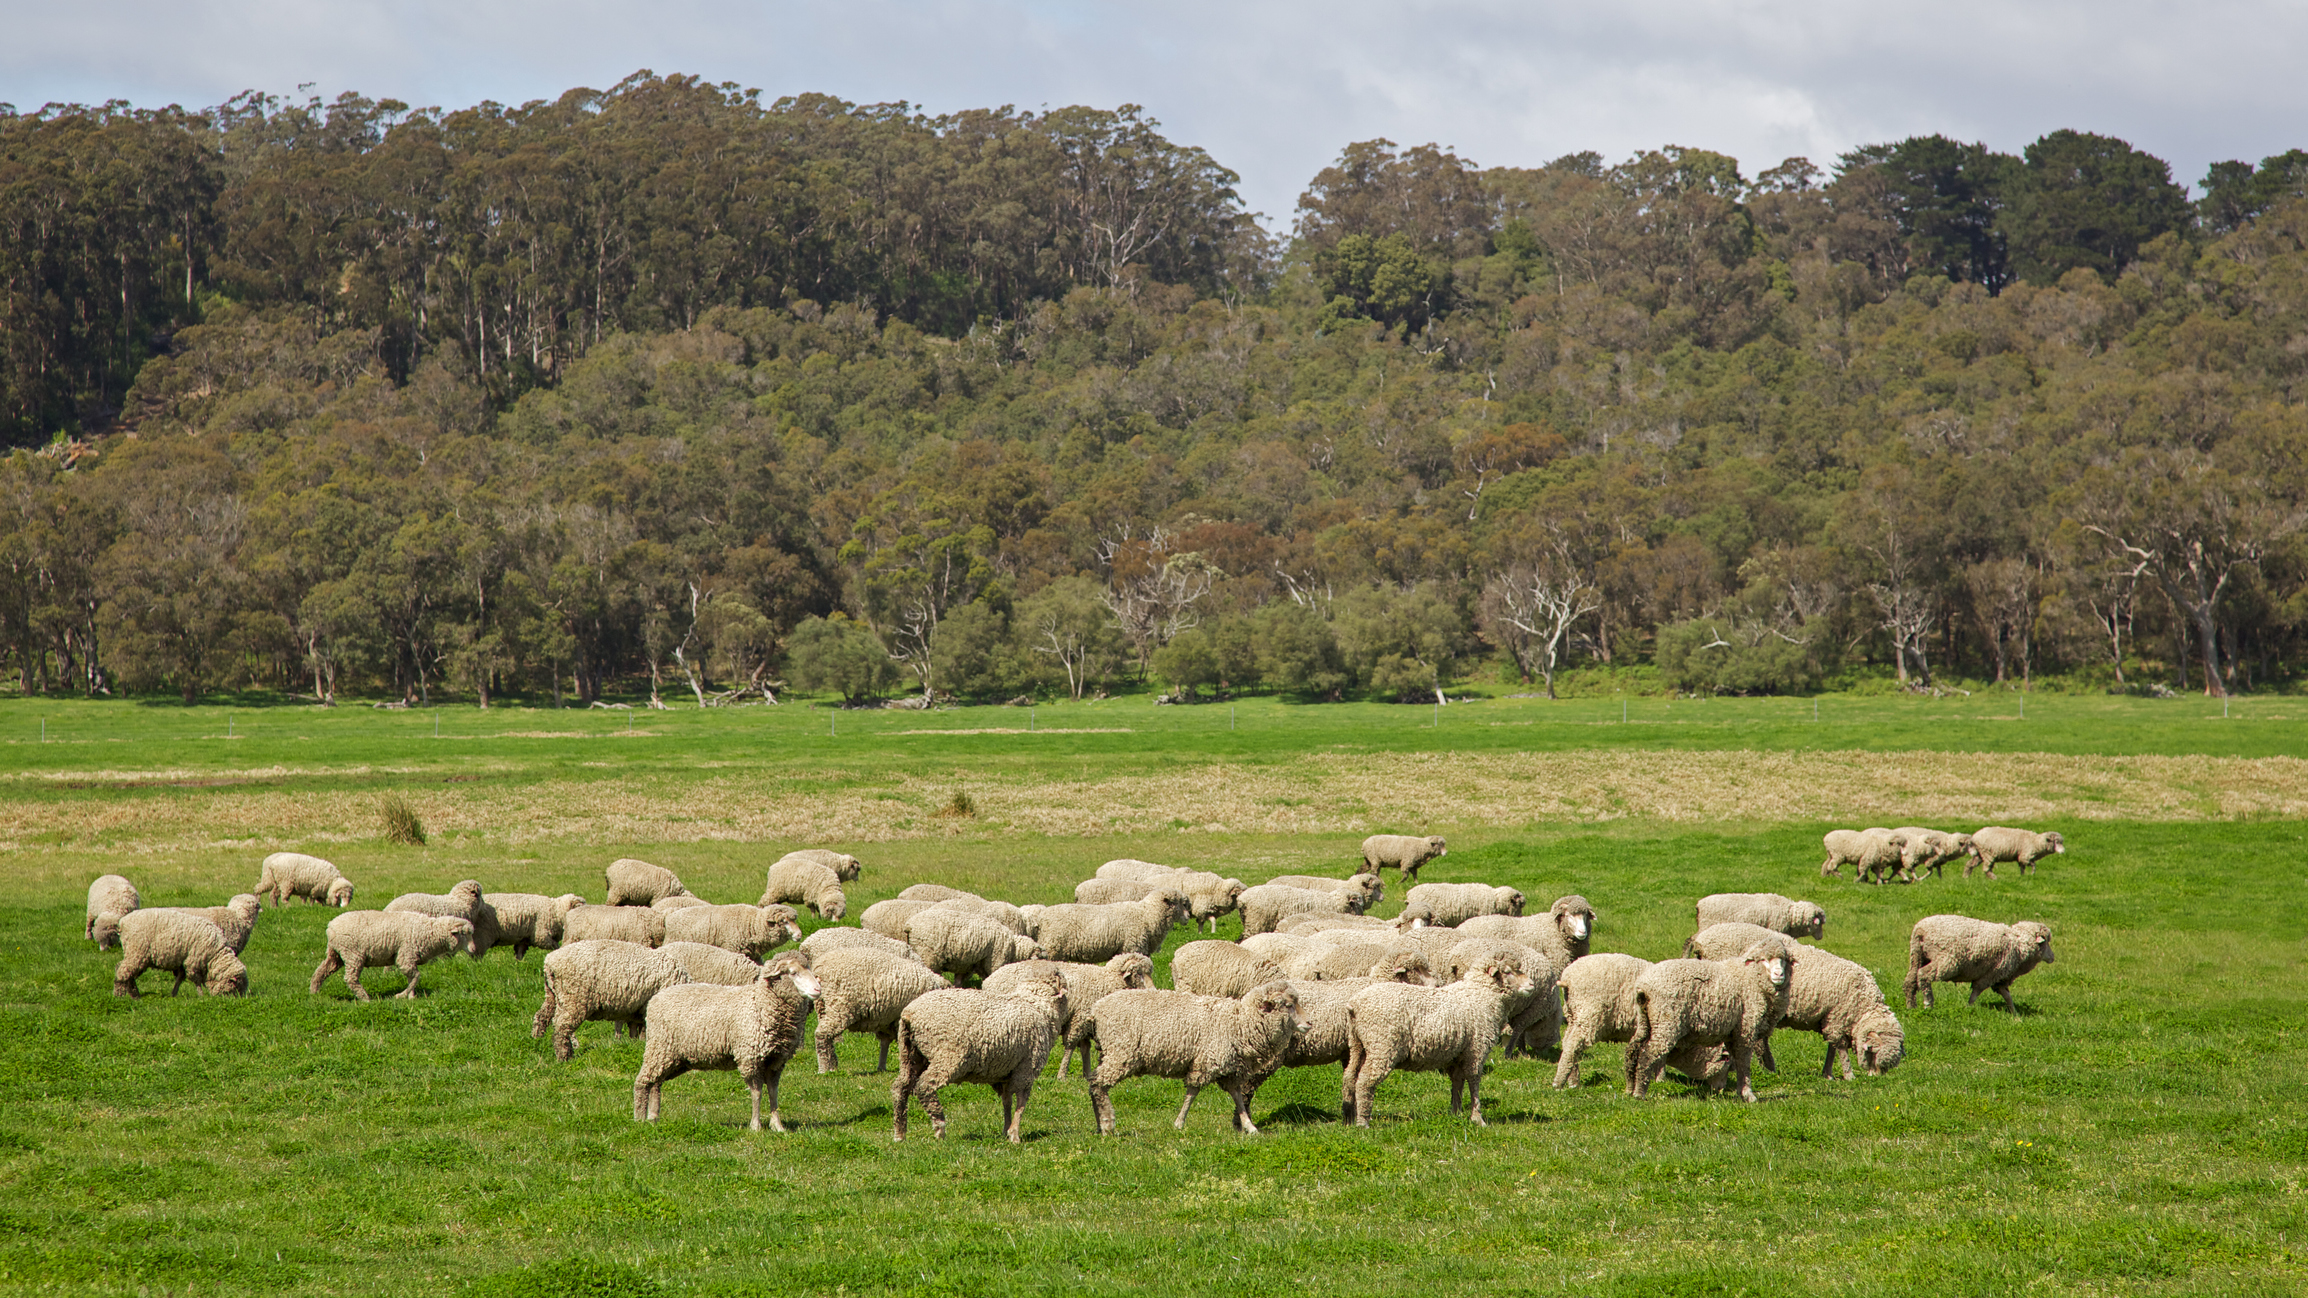
Agricultural emissions primarily stem from livestock, but this sector is linked to a wide range of emissions sources.
These include the use of synthetic fertilisers, specific treatments of manure and other agricultural waste, as well as supporting activities like fuel consumption for machinery such as tractors. Seperating the “additional” emissions from agricultural activities from the natural carbon cycle can be complicated. There are a number of different models that are used to account for these emissions, this website uses the GWP100 method. You can read more about that method and why we use it here.
Cattle are associated with high emissions, but all livestock produce emissions at a higher rate compared to broadacre crops, horticulture or grape production. In Albany and Denmark, around a third of emissions are from agricultural sources, whereas in Plantagenet and Jerramungup, this figure increases to about two-thirds. This highlights that even minor alterations in emissions from the agricultural sector can have significant impacts for municipality emissions overall. Agricultural emissions are subject to seasonal variations and can be influenced by weather and climate trends. In the region, agricultural emissions have remained relatively stable in recent years but in times of drought, when farmers destock, emissions can drop significantly.
Carbon Emissions from Agriculture
The total annual emissions within the agricultural sector (total = 601,000 tCO₂e, 21/22) for the South Coast region. Hover over the donut to see the emissions for each agriculture subsector. Source: snapshotclimate.com.au
Sector action impact
The agricultural sector is actively involved in extensive research, experimentation and innovation aimed at reducing emissions.
Through a combination of applying conventional sustainability practices at scale, improved management approaches, and innovative feeding and nutrient regulation, there are a range of options that may substantially decrease emissions over time from this vital part of the economy.
Through local action we may reduce emissions by almost 50% above baseline estimates by 2050.
Projected Impacts for Business as Usual vs Action for Agriculture
Emissions projections for agriculture for the South Coast region from 2022 to 2050. The red line indicates the projected emissions if the agricultural sector were to continue Business as Usual. The green line shows the potential reduction in emissions if all agriculture-related actions on this website are implemented. Source: South Coast Alliance Regional Net Zero Plan – Ironbark Sustainability 2022
Opportunities for Action
The agricultural sector is diverse, with many solutions relevant only for specific commodities or regions.
The Primary Industries Climate Challenges Centre has developed a series of Greenhouse Accounting Frameworks for Australian agriculture and horticulture. These tools can help to estimate the size and sources of greenhouse gases emitted from farms, in a way that aligns with the National Greenhouse Gas Inventory.
Delve into the individual actions within this sector for more information.
Projected Impacts from Actions for Agriculture
The estimated impact on carbon emissions from agriculture actions for the South Coast region from 2022 to 2050. Hover your cursor over the bars to see how different agriculture actions can reduce emissions each year. Source: South Coast Alliance Regional Net Zero Plan – Ironbark Sustainability 2022