Households
What’s happening now
In the South Coast region, households are directly responsible for almost 10% of total emissions, mostly from electricity use for appliances, heating and cooling and lighting.
Across Australia there is a shift towards more energy efficient buildings and appliances. Households can speed up this trend through the decisions they make when purchasing new appliances, renovating or building a new home, and shifting towards active transport (such as walking, cycling or taking public transport) and electric cars.
Household emissions are generally trending down across all residential homes as more renewables are added to the electricity grid and as residents better understand the cost savings of well-insulated homes and more efficient electrical appliances. The health benefits of living in a comfortable house are also better understood and increased local, state and federal schemes are supporting electrification of homes and apartments.
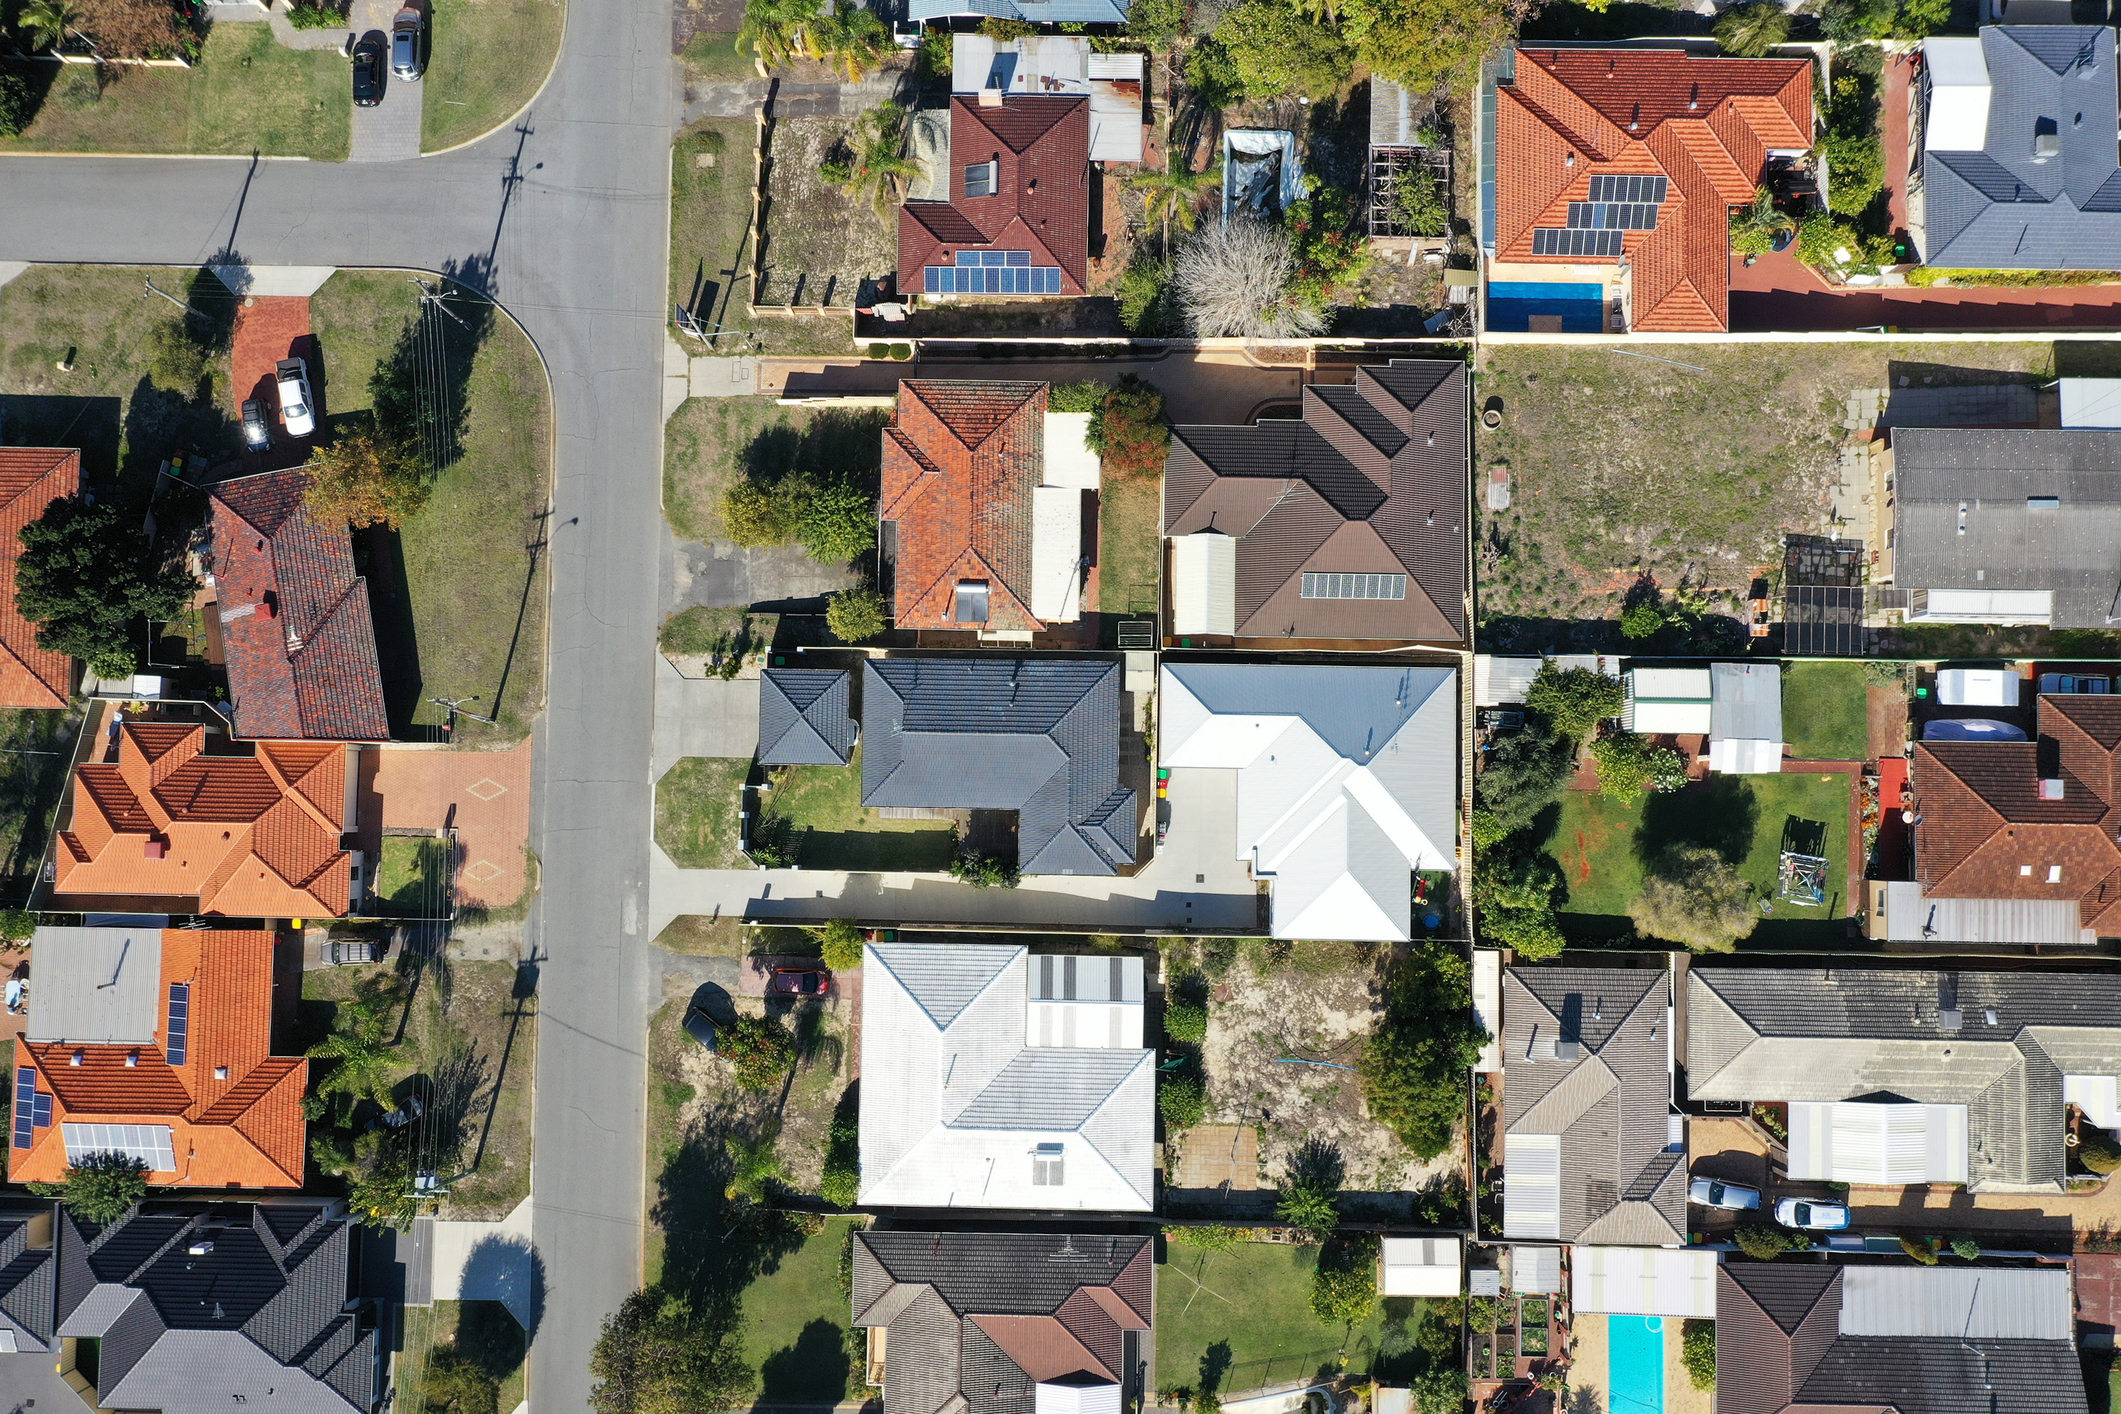
The region has already embraced renewable energy with significant adoption of rooftop solar installations and the presence of windfarms in Denmark, Mount Barker, Bremer Bay and Albany. This provides an excellent opportunity to leverage the existing momentum and continue reducing household emissions.
Carbon Positive Australia provides a Personal Carbon Footprint Calculator that can help you understand your impact and where you might be able to reduce your household emissions.
Carbon Emissions from Households
The total annual emissions attributed to households for the South Coast region, separated by source (total = 91,000 tCO₂e, 21/22). Hover over the donut to see how much carbon comes from electricity (dark blue) and how much from gas (aqua). Source: snapshotclimate.com.au
Installed Solar PV Systems for the Region
Solar uptake in the South Coast Region over the last 20 years. Hover over the graph to see the total number of systems installed over time for each community. Source: Clean Energy Regulator
Sector action impact
There are many easy and affordable ways households can reduce emissions. Individual households can even reduce their emissions to zero with combinations of renewable energy, electrification, building efficiency and GreenPower purchasing.
Based on potential adoption rates for the community, the emissions from households in the region could be reduced by almost 60% beyond baseline estimates by 2050.
Projected Emissions for Business as Usual vs Action for Households
Chart showing the projection of emissions from households for the South Coast region. The red line indicates the projected emissions if households were to continue Business as Usual. The green line shows the potential reduction in emissions if all household-related actions on this website are implemented. Source: South Coast Alliance Regional Net Zero Plan – Ironbark Sustainability 2022
Opportunities for Action
There are many actions that households can take to learn about and plan emissions reducing activities. Delve into the individual actions within this sector for more information.
Projected Impact of Actions for Households
The estimated impact on carbon emissions from household emissions reduction actions for the South Coast region from 2022 to 2050. Hover your cursor over the bars to see how different household actions can reduce emissions each year. Source: South Coast Alliance Regional Net Zero Plan – Ironbark Sustainability 2022